How to Read Contour Lines on a Walking Map
Contour lines can look confusing when you first open a walking map.
There may be dozens of thin lines running across the page, sometimes packed closely together and sometimes spread far apart.
But contour lines are actually giving you one of the most useful pieces of information on the entire map:
They show you the shape and height of the land.
Once you understand them, you can start to picture hills, valleys, ridges and steep slopes before you ever reach them.
What Is a Contour Line?
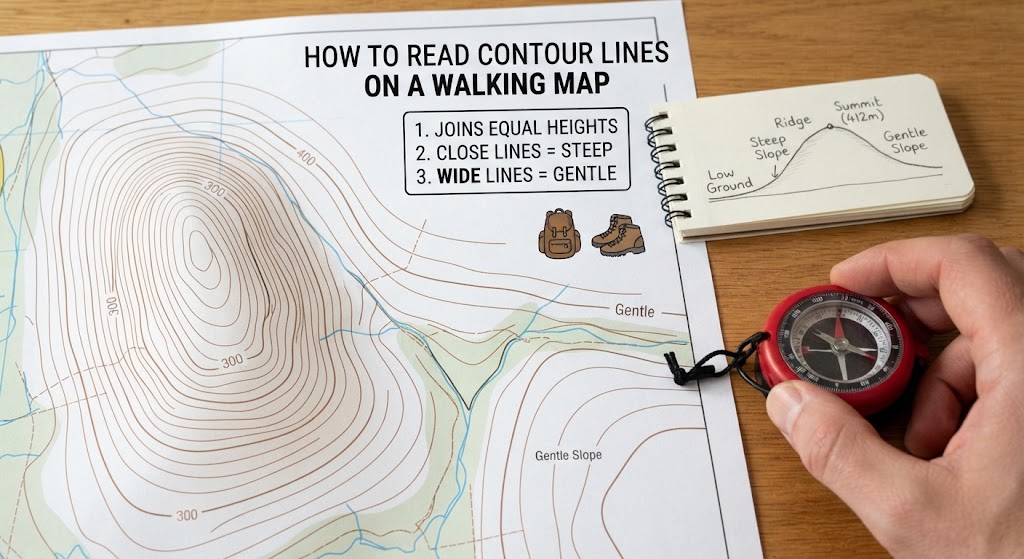
A contour line joins points that are at the same height above sea level.
In other words, every point along one contour line has the same elevation.
Imagine walking around the side of a hill without going uphill or downhill.
If you could draw a line showing everywhere you stayed at exactly the same height, that would be a contour line.
A walking map uses many of these lines at different elevations to represent the three-dimensional landscape on a flat sheet of paper.
The Most Important Rule
There is one rule you should learn first:
Close contour lines mean steep ground.
Wide gaps between contour lines mean gentler ground.
That’s the basic principle behind reading contours.
If your planned route crosses a section where the lines are tightly packed, expect a steeper slope.
If the lines are widely spaced, the ground is generally more gradual.
What Do the Numbers on Contour Lines Mean?
Some contour lines have numbers printed on them.
These numbers show the elevation of that line.
For example, a line labelled 200 represents land at 200 metres above sea level.
Another line labelled 300 represents land at 300 metres.
The difference between neighbouring contour lines is called the contour interval.
Always check the map legend because the interval can vary between maps and map series. UK walking maps can use different contour intervals depending on the map and terrain.
What Is an Index Contour?
Some contour lines are drawn more prominently than others.
These are often called index contours and are normally labelled with their elevation.
They make it easier to work out the general height of the surrounding terrain.
Instead of trying to read every single line, you can use the labelled lines as reference points and count the intermediate contours.
How to Spot a Hill
A hill usually appears as a series of roughly enclosed contour lines.
Imagine drawing several irregular circles, one inside another.
As you move towards the centre, the elevation increases.
If the inner contours have higher numbers, you’re moving uphill.
The closer you get to the centre, the nearer you are to the higher ground.
How to Spot a Valley
Valleys have a characteristic contour pattern.
Contour lines often form a V shape where they cross a valley.
The shape and surrounding elevation can help you work out which direction the valley runs.
This becomes particularly useful when combined with streams, rivers and other map features.
Instead of seeing a collection of random lines, you begin to see the landscape represented on the map.
How to Spot a Ridge
A ridge is a long area of higher ground.
Contour lines can bend around it in a way that shows the higher ground extending out from a hill or summit.
Look for the relationship between several contour lines rather than trying to interpret one line on its own.
The aim is to start seeing the overall shape of the land.
How to Tell Which Way Is Steepest
Look at the spacing between the lines.
For example:
Very wide spacing: gentle slope
Moderate spacing: noticeable slope
Very close spacing: steep slope
If the lines suddenly become much closer together, you’ve reached a section where the ground becomes steeper.
This is extremely useful when planning a walk.
You can identify the difficult sections before you arrive.
What Do Almost-Overlapping Contour Lines Mean?
When contour lines become extremely close together, the ground is very steep.
In some situations, particular map symbols are used to show cliffs or other significant features.
Don’t assume that every tightly packed group of contours represents a climb you should simply walk straight up.
Use the rest of the map to understand what the terrain actually contains.
Count the Contours to Estimate Height Gain
Contour lines can help you estimate how much climbing is involved.
First, find the contour interval on your map.
Then count the number of contour intervals between two points.
For example, if the contour interval is 10 metres and your route crosses five intervals upwards:
5 × 10 m = 50 m of height gain
This gives you a much better understanding of the route than distance alone.
Contour Lines and Walking Time
Contour lines can also help explain why two routes of the same distance may take different amounts of time.
A 5 km route over relatively flat ground may be considerably easier than a 5 km route involving repeated steep climbs.
This is one reason route planners consider both distance and ascent when estimating walking time.
Use Contours Before Choosing Your Route
Don’t wait until you’re already on the hill.
Look at the map before setting off.
Ask:
- Where is the highest point?
- Where are the steepest slopes?
- Where are the gentler sections?
- Where are the valleys?
- Does the route climb continuously?
- Does it repeatedly climb and descend?
- Is there a more gradual alternative?
This can help you choose a route that better matches your group’s ability.
A Simple Contour-Line Practice Exercise
You can practise at home.
Take a walking map and choose a hill you know.
Before looking at photographs or descriptions, study the contours.
Try to answer:
Where is the summit?
Which side is steepest?
Where would the easiest approach be?
Where does the land flatten out?
Then compare your prediction with what you know about the actual landscape.
Try Drawing the Hill
Another useful exercise is to imagine slicing through the hill from one side to the other.
Turn the contour information into a simple side-on profile.
You don’t need an accurate drawing.
Just sketch:
- Low ground
- Rising slope
- Steep section
- Summit
- Descending slope
This helps turn the flat map into a mental picture.
Contour Lines and Navigation
Contour lines become even more useful when combined with other map features.
Use them alongside:
- Paths
- Roads
- Streams
- Buildings
- Woodland
- Ridges
- Summits
- Grid references
The more features you compare, the easier it becomes to match your map with the real landscape.
Don’t Rely on Contours Alone
Contour lines tell you about elevation and terrain shape, but they don’t tell you everything.
A route can still be affected by:
- Mud
- Vegetation
- Water
- Fences
- Path conditions
- Weather
- Erosion
- Temporary closures
A good navigator uses the whole map rather than focusing on one feature.
The Three Things to Remember
If you forget everything else, remember these three rules:
1. A contour line joins points of equal height.
2. Close lines mean steep ground.
3. Wide lines mean gentler ground.
Once those ideas make sense, the rest becomes practice.
A Quick Contour Challenge
Pick a walking route you’ve never completed.
Without looking at photographs, answer:
- Where is the highest point?
- Where is the steepest section?
- Where will you climb?
- Where will you descend?
- Where does the route become flatter?
Then walk the route and see how closely your interpretation matches reality.
That’s how contour lines stop being mysterious lines on a map and start becoming a picture of the landscape.
🔒Ready to test your survival skills?
Join Survival Guides UK for free, complete challenges, earn badges and increase your Survival Level.
JOIN FREE →
CRAIG BURR
FOUNDER · SURVIVAL GUIDES UK
I'm Craig, the person behind Survival Guides UK. I created SGUK because I wanted somewhere people could learn real outdoor skills in a practical, straightforward way — from lighting a fire and tying knots to navigation, campcraft and everything in between.
You can read more about the story behind SGUK here as well as our approach here.